
When raising an issue, the following information may be needed:
Screenshots (for UI issues)
A good way to give an example of an issue is to take a screenshot and send the resulting JPEG image. When taking a screenshot make sure you include the browser address bar so it is clear what URL you were accessing. Before you take your screenshot, it is often a good idea to open the Browser Console (noted below) too so that you can capture both the issue and any errors too.
Windows
- Windows key + Print Screen: takes a screenshot of all screens and saves it to the Pictures\Screenshots folder in your documents
- Print Screen: takes a screenshot of all screens and puts it in the clipboard for you to open. Paint and paste it then save it as a JPEG (do not save it as a BMP as that will be too large)
- Windows key + Shift + S (Windows 10 or newer): allows you to draw the area to capture and opens it in the Snip tool allowing you to save it
Note: on some keyboards you may need to push a "Fn" key along with these keys to be able to use the "Print Screen" button.
Mac
- Command + Shift + 3: takes a screenshot of all screens and save it as a file to your desktop
- Command + Shift + 4: allows you to draw the area to capture and then saves it as a file to your desktop
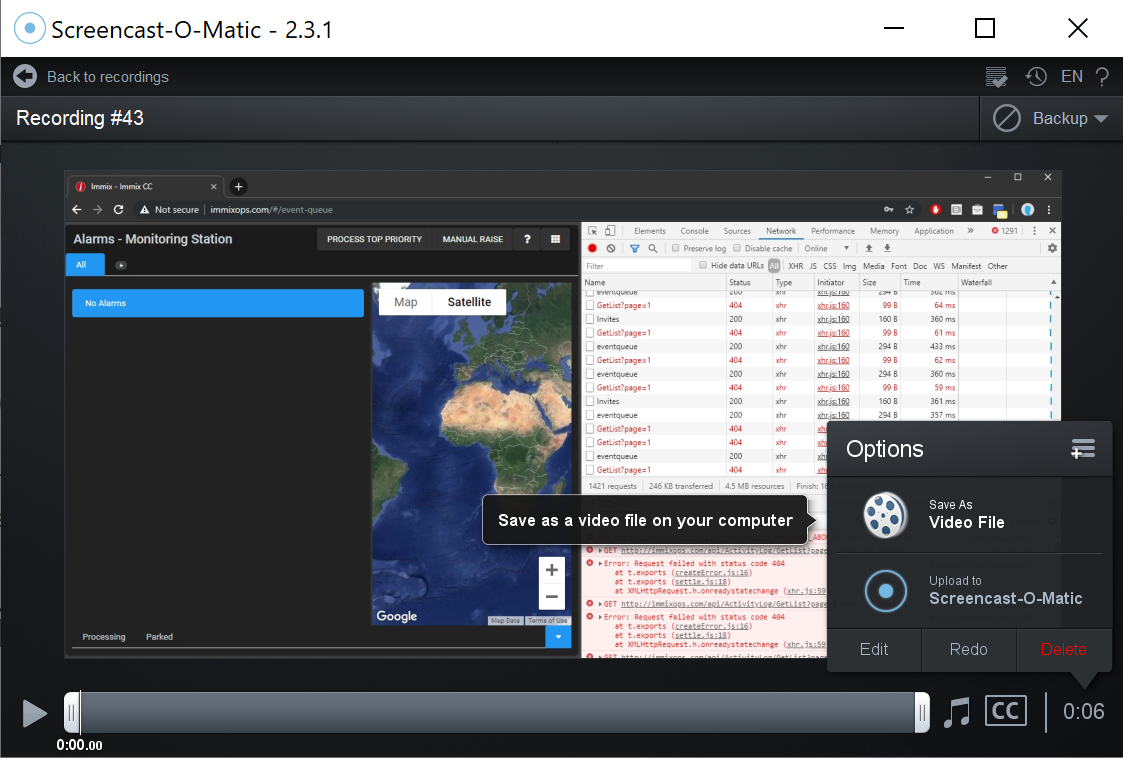
Screencasts (for UI issues)
An even better way of capturing a UI issue is to record a screencast and send the resulting video. This allows everyone to see all the steps you took leading up to the occurrence of the issue.
Use the free Screencast-o-matic tool to do this and choose "Save As Video File" . Send the resulting MP4 file (it will embed a watermark in the video when because it is being used for free, but this is not an issue).
It is often a good idea to open the Browser Console (noted below) before you record the screencast as you will then capture both the issue and as well as any errors.
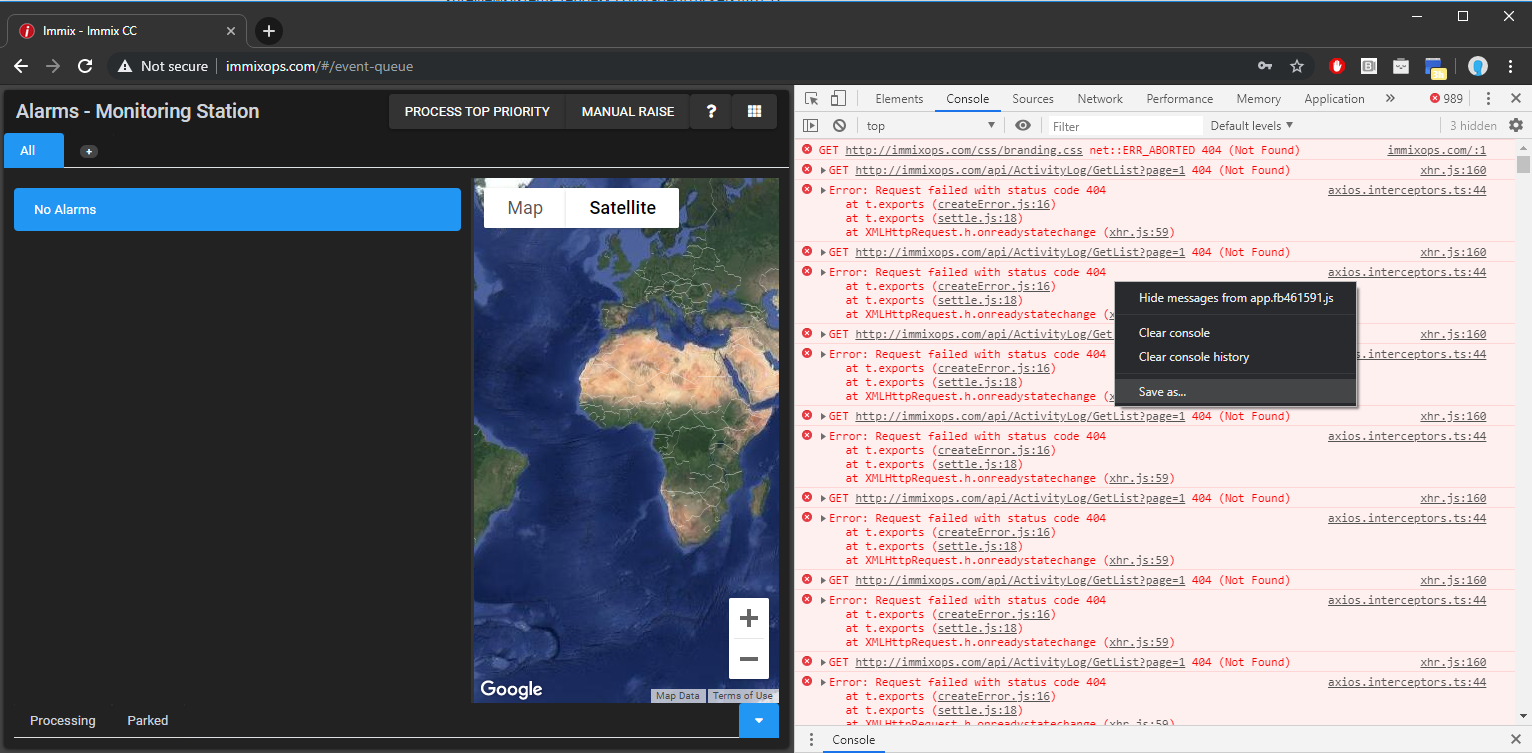
Browser Console Log (for UI issues)
Often any UI issues will show as errors in the browser's console so saving and sending the console log will help identify the cause of a problem.
Chrome
Press Ctrl+Shift+J (Windows) or Ctrl+Option+J (Mac) to open the Console. Then right-click on any of the entries and choose "Save as..." then, send the resulting file.
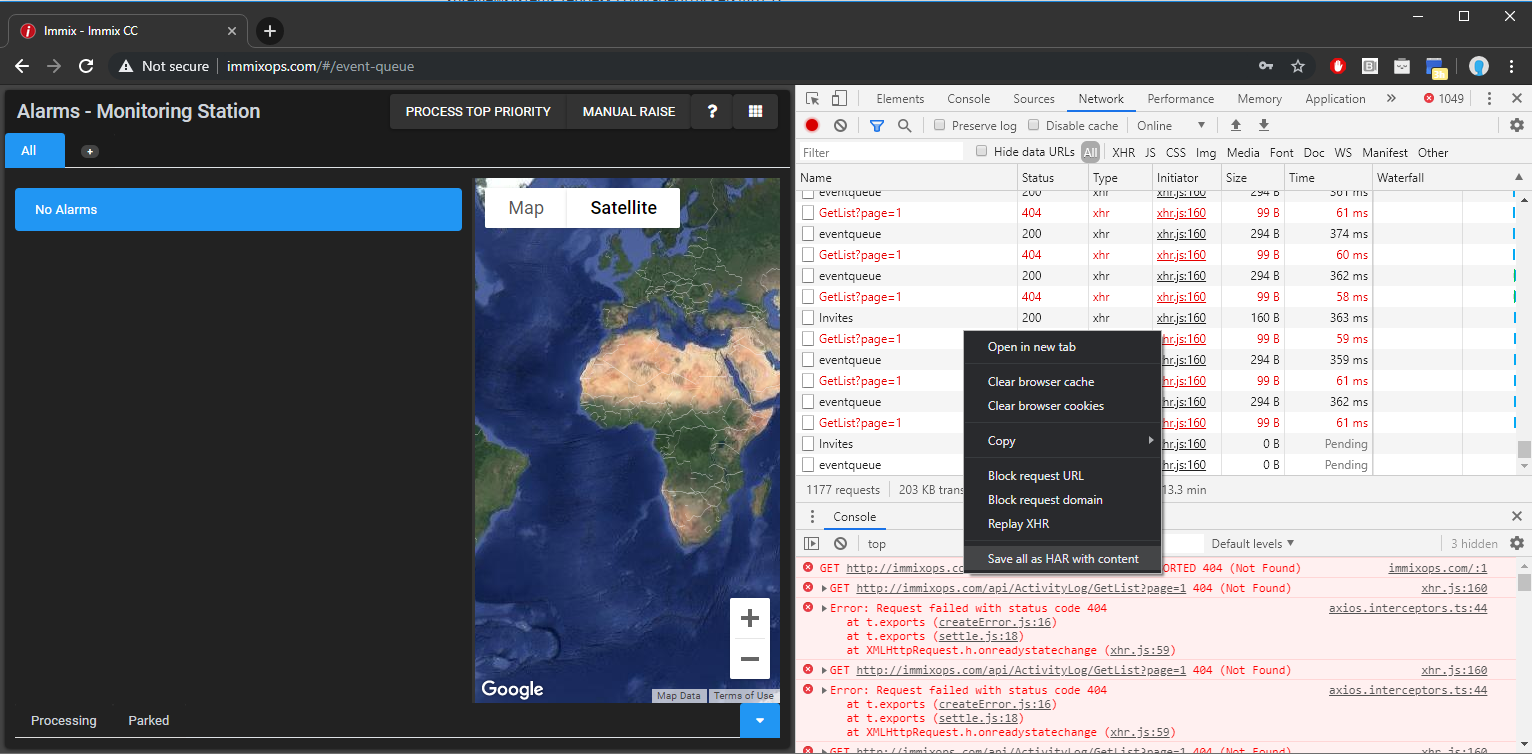
Browser Network Activity / "HAR file" (for UI issues)
Sometimes UI issues are a result of slow or failed or slow network requests. This can be seen in the Browser Network Activity log and saved to an HTTP Archive (HAR) file.
IMPORTANT: the browser's Network Activity screen captures everything being sent during a login, including usernames and passwords. When sharing screenshots and HAR files with others you should start the capture AFTER logging in to avoid including your login information.
Chrome
Press Ctrl+Shift+I (Windows) or Ctrl+Options+I (Mac) to open the developer tools then go to the "Network" tab (note this has to be open before you cause the problem), then cause the problem and you will see all the network requests going from the browser. To save it right-click on any of the entries and choose "Save All As HAR with content", then send the resulting file.
Feature List - Functionality.json (for UI issues)
Note: Only Sureview Administrators will have access to this setup screen
Go to the Feature List screen by clicking the Menu icon (top right corner) then the "FEATURE SETUP" button.
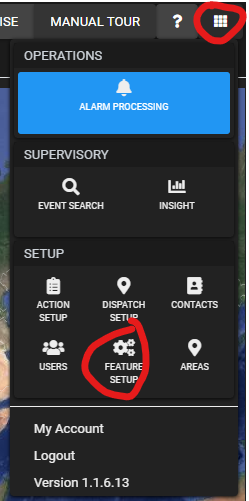
Once on the features screen click the EXPORT button (in the bottom left of the Features screen) and download Functionality.json file.

Service Logs (for service issues)
All SureView services can provide live, "trace" log output of what they are doing; either by writing to a rotating file or by telnetting to a TCP port.
Rotating Trace File
All recent services automatically include the "SureView.Logging.dll" file needed to enable logging of trace output, rotating-file-logging with default settings.
If it is not included. you may enable rotating-logging by downloading the DLL from the attachment on this page. Copy it into the service's folder and enable it by adding the following entry to the service's ".exe.config" config file (restarting the service afterwards to apply the change):
<configuration>
  ...
  <system.diagnostics>
    <trace autoflush="true">
      <listeners>
        <add name="RotatingFile" type="SureView.Logging.RotatingFileTraceListener,SureView.Logging" initializeData="" />
      </listeners>
    </trace>
  </system.diagnostics>
  ...
</configuration>
By default without specifying any options you will get:
- The log files written to the same folder as the application starting with the name "Log" (which then has the time the file was started and ".log" added to it)
- Max number files before the oldest is overwritten = 7
- Max size of each file before making a new one = 10MB
- Max age of each file before making a new one = 1 day
i.e. a new log file will be created every day or when the file reaches 10MB, with a max of 7 files being made, with the files being created in the same folder as the application and starting with the name "Log"
For more advanced configurations you can edit the entry to change all of the default values, for example:
<add name="RotatingFile" type="SureView.Logging.RotatingFileTraceListener,SureView.Logging" initializeData="Subfolder\MyLogStart" MaxFiles="7" MaxSize="10000000" MaxAge="2.00:00:00" />
Which will set a max of 7 files, with a new file being started after 2 days or when it reaches 10MB (10,000,000 bytes) in size, written to a folder inside the directory of the application called "Subfolder" with the file name starting with "MyLogStart"
Trace Port
Refer to the integrations support page to find the trace port number that the service uses, then use the telnet command with the -f argument to connect to it and save the output to file.
Comments
0 comments
Please sign in to leave a comment.