Insights is the built in reporting software provided by Sureview.
Note: If you are using Sureview with an On-Prem server solution you must have a separate reporting server to host and run the reporting database and interface
Insights can be used to see general event statistics such as outcome frequencies, as well as more specific applications, such as identifying individual alarm points that consistently throw nuisance alarms.

On the left you will be able to select report you want
After selecting a report you will able top apply filters such as Areas, Categories or Users as well as Date Ranges and Report Types (Bar Char, Pie Chart etc)

You are also able to download the raw data as a CSV file using the download button  and import this to your preferred spreadsheet or reporting software.
Note: The list of available reports may differ depending on your individual account preferences. If you do not have a report in this list but need it (or have a request for a specific report that isn't included) please raise a support ticket and a member of our team will be happy to help.
Activity Report
This report will generate a PDF report with the main Event/Alarm Details over a DateTime range. This includes
- Start & End times
- Operator Name
- Area Name
- Event Category/Outcome
- Event Category/Outcome Notes
Event / Alarm Statistics Section
Alarm Count by Area
This report shows the count for Alarm Events per Area. While in this report you can drill down to the Alarm Count by Point report. You can filter this report as needed (for example: Only show "Door Forced" alarms)
Alarm Count by Day
This report shows the count for Alarm Events by date/date. While in this report you can drill down to the Alarm Count by Hour report. You can filter this report as needed (for example: Only show alarm counts for Area "400 North Ashley"
Alarm Count by Outcome (Category)
This report is based on the outcome/category of the alarm event. (What the operator logs the event as when they close it). You can drilldown to the "Alarm Count by Operator" report by clicking on one of the data bars in the chart
Alarm Count by Point
This will report on the number of alarms received by indiviudal alarm points/responses. It is particularly useful for identifying problem points which could be over-alarming due to mechanical faults (e.g. faulty door foorced sensor) or perhaps due to people not following policy or needing additional training (e.g. A entrance door being regularly propped open).
Alarm Count by Type
Alarm data grouped by the Alarm Type (e.g. Door Forced, Door Held Open, Terminated Badge, Perimeter Breach Detection, Slip & Fall Manual Raise Alarm etc)
Alarm Event List
This is a simple table list showing the individual alarm events that match your provided features. It includes:
- EventID
- Created DateTime
- Closed DateTime
- Response Time (how long did it take for an operator to pick up the alarm after it was triggered)
- Processing Time (How long did it take for an operator to close the alarm event after it was picked up)
- Operator (which operate handled the event)
- Area
- Outcome/Category
- Outcome/Category Note
- Incident (Was this event marked as an Incident or not?)
Maintenance Section
Mapped / Unmapped Devices
This report will list all devices (Cameras, Relays/Outputs etc) along with their mapping information (Floor/Elevation and LatLong details). If a device has not been mapped the Floor & LatLong cells will be left blank.
Performance
The performance reports (listed below) provide you with operator and area performance stats including response time (how long does it take to pick up an alarm from the queue), processing time (how long does it to take to close an event after it has been picked up) and alarm counts.
Alarm Count by Operator
Avg. Processing Time by Area
Avg Processing Time by Operator
Avg Response Time by Area
Avg Response Time by Operator
Permissions
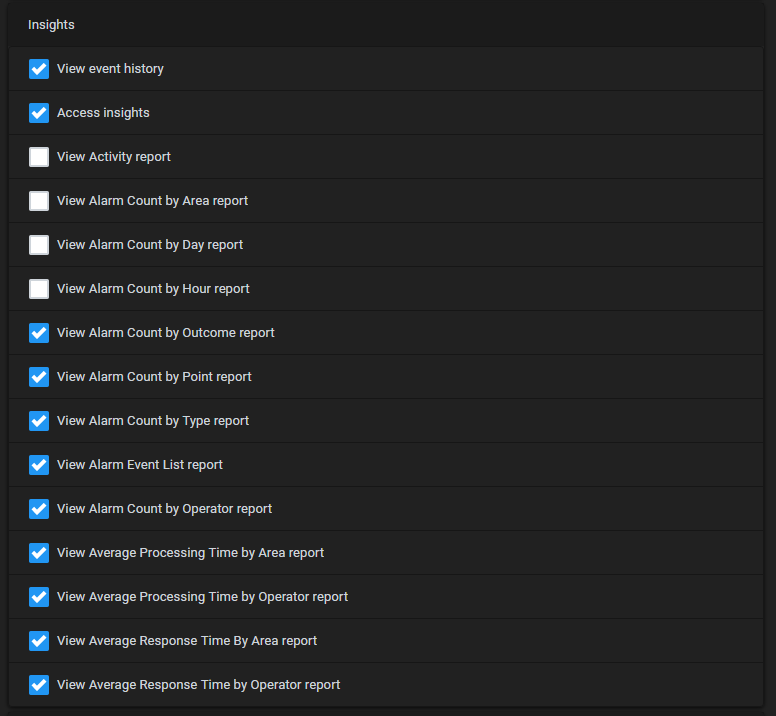
If the current user belongs to a user group, the user group must have permissions to see each report. The screenshot below shows the permissions available from within the User group setup interface. If the user does not belong to a user group, they will only require the legacy View Reports permission.

If you attempt to access a report you do not have permission for, an error message will be displayed. Please contact your system administrator if you believe this to be a mistake.

Troubleshooting
Timeouts
Issue
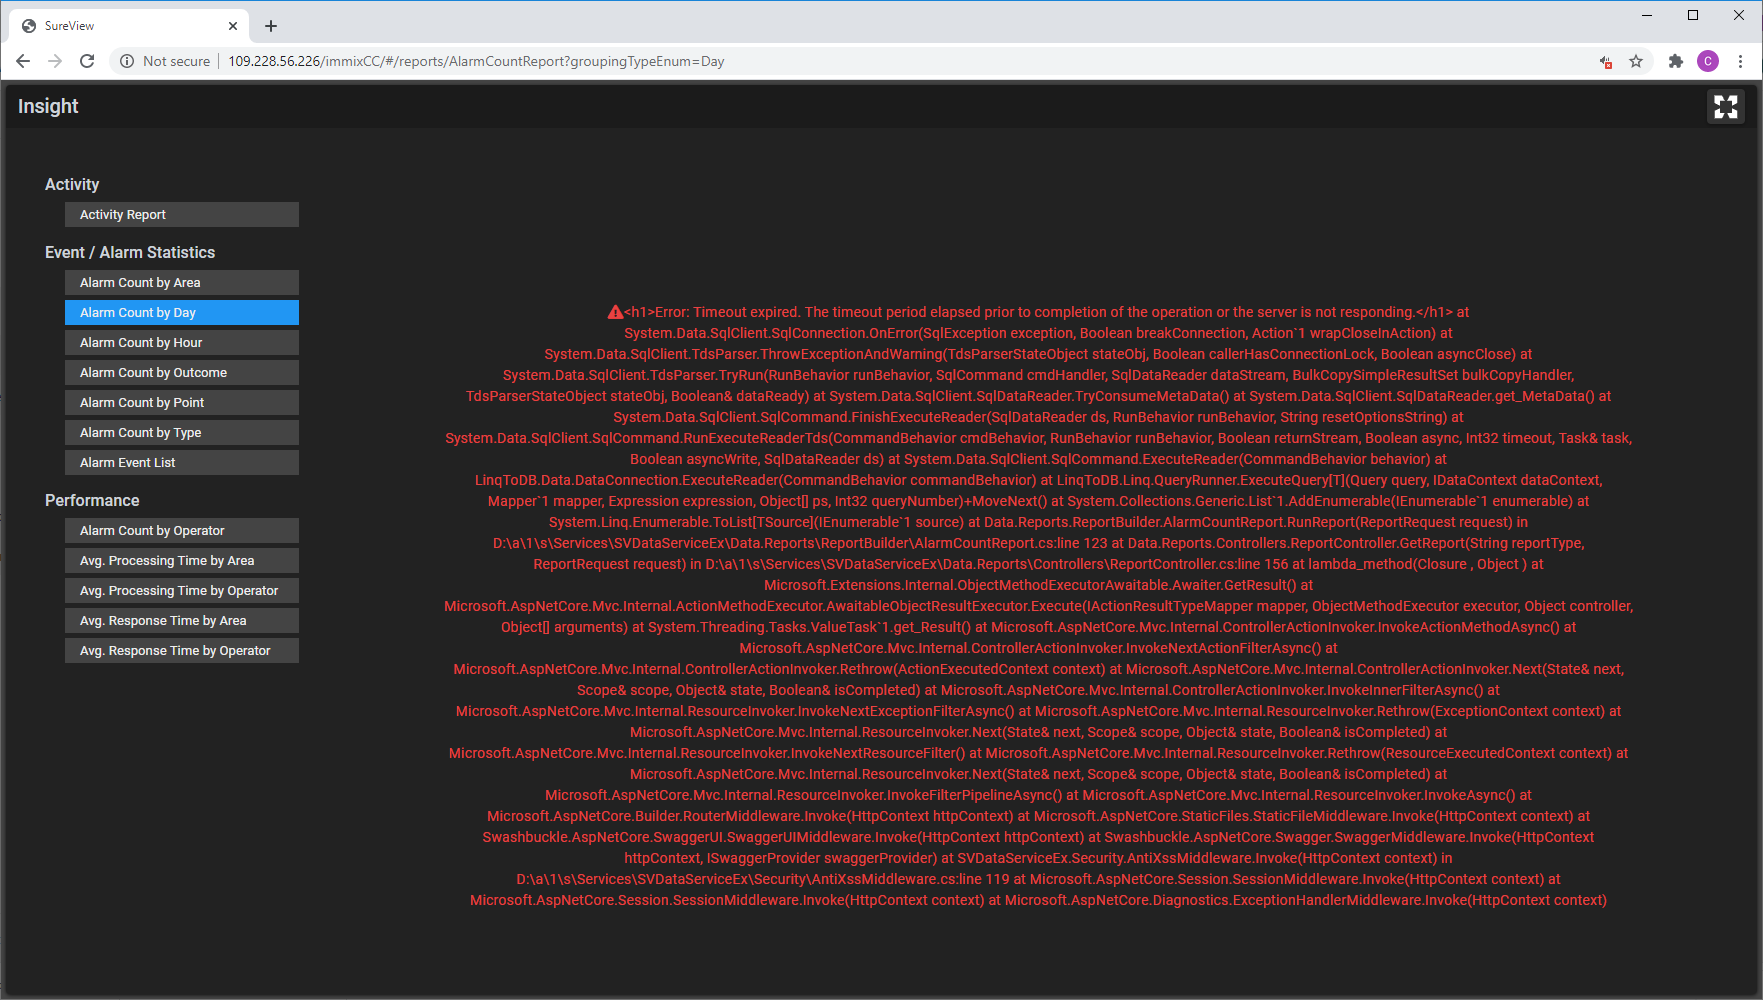
In certain circumstance a long running report can result a timeout. This could show as 'Connection Timeout Expired' or 'Timeout Expired' within the stack trace.

Solution
Update the following setting in the appsetting.json for the V2 Data Service
        "ReportingSettings": {
                "ReportTimeoutSeconds": 300
        }
N.B. If this setting is not present the default timeout period of 30 seconds is used.
Also if connection timeouts are still experienced the 'SQLReportConnectionString' in the appsettings.json needs to include'Connection Timeout=<numberOfSeconds>'
Comments
0 comments
Please sign in to leave a comment.